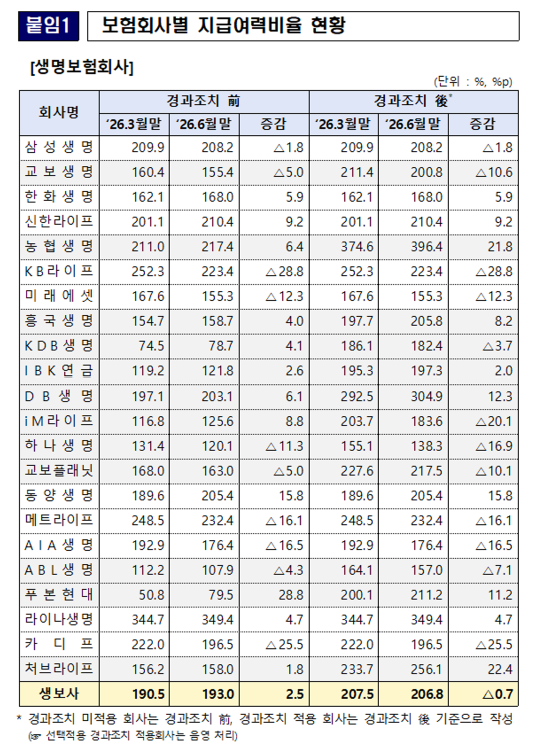
According to recent statistics released by the Financial Supervisory Service (FSS), although the available capital of insurance companies increased significantly due to rising stock prices of their investments, the overall solvency ratio declined compared to the previous quarter. This phenomenon occurred not only because capital increased, but also because the equity risk amount rose in tandem with the stock price gains. This metric, which indicates whether the insurance products we have purchased can reliably pay out insurance benefits at any time, is a core gauge for assessing a company’s management status. As the trends of life insurance and non-life insurance companies diverge, it is essential to carefully examine the underlying financial health hidden behind these figures. This is precisely why we should pay close attention to the stability of the company when purchasing insurance. In this article, we will explore the background behind why the solvency ratio stagnated despite the positive news of rising stock prices in an easy-to-understand manner.
=
Why Insurance Companies’ Solvency Ratios Fell Despite Rising Stock Prices: An Analysis of Increased Risk Amounts
1. The Two Faces of Rising Stock Prices: Simultaneous Increase in Available Capital and Risk Amounts
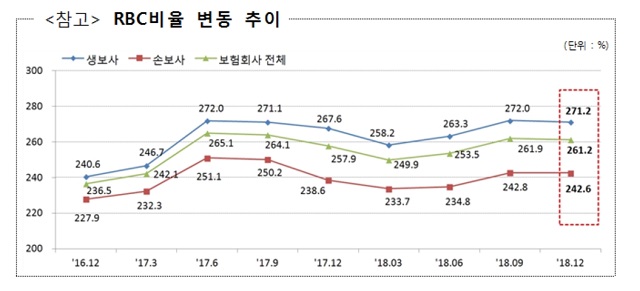
Examining the financial statements of insurance companies reveals a rare trend where available capital has surged by tens of trillions of won thanks to the recent bullish stock market. In fact, after the application of transitional measures, total available capital recorded a steep increase of over 20% compared to the previous quarter, appearing to fill the company’s coffers securely. This was driven decisively not only by the substantial net income for the period earned by insurance companies but also by a significant increase in accumulated other comprehensive income resulting from the soaring value of their held stocks. However, this expansion of capital paradoxically also increased the magnitude of potential risks embedded in their assets. As stock prices rose, the equity risk amount also ballooned significantly, driving up the required capital. Consequently, the denominator (required capital) grew more sharply than the numerator (available capital), resulting in the anomaly of the ratio itself declining.
If capital increases but risks grow alongside it, the ratio inevitably falls.
While rising asset values led to capital expansion, the ratio declined due to the increase in risk amounts.
2. Diverging Fortunes: Life Insurance vs. Non-Life Insurance Companies
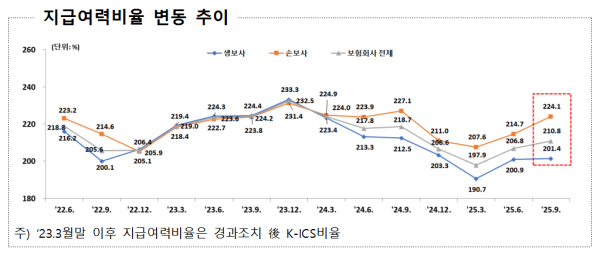
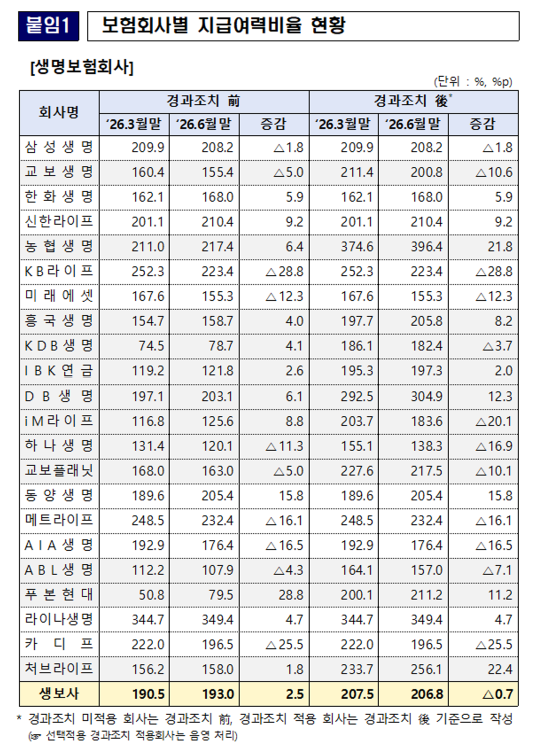
Looking closely at detailed metrics by sector, a clear temperature difference is felt between life insurance and non-life insurance companies, sparking interest. Life insurance companies saw a slight decline in their overall solvency ratio, entering a period of consolidation, while non-life insurance companies, in contrast, rode an upward trend. The average ratio for life insurers dropped compared to the previous quarter, while non-life insurers saw a slight rise, fully revealing the differences in the nature of their respective investment portfolios. The individual performance of major life and non-life insurance companies commonly encountered by consumers also varied widely, with some companies experiencing significant drops and others seeing substantial gains. These differences were determined by the proportion of stocks held by each company and how meticulously their asset management strategies were crafted. From the policyholder’s perspective, it is wise to carefully assess which category their insurance company falls into and whether it is maintaining stability well.
Differences in asset management approaches between life and non-life insurers determined the divergence in these metrics.
Life insurance companies showed a downward trend, while non-life insurance companies recorded an upward trend, highlighting sector-specific differences.
3. The Significance of Transitional Measures and the Industry’s Adaptation Process
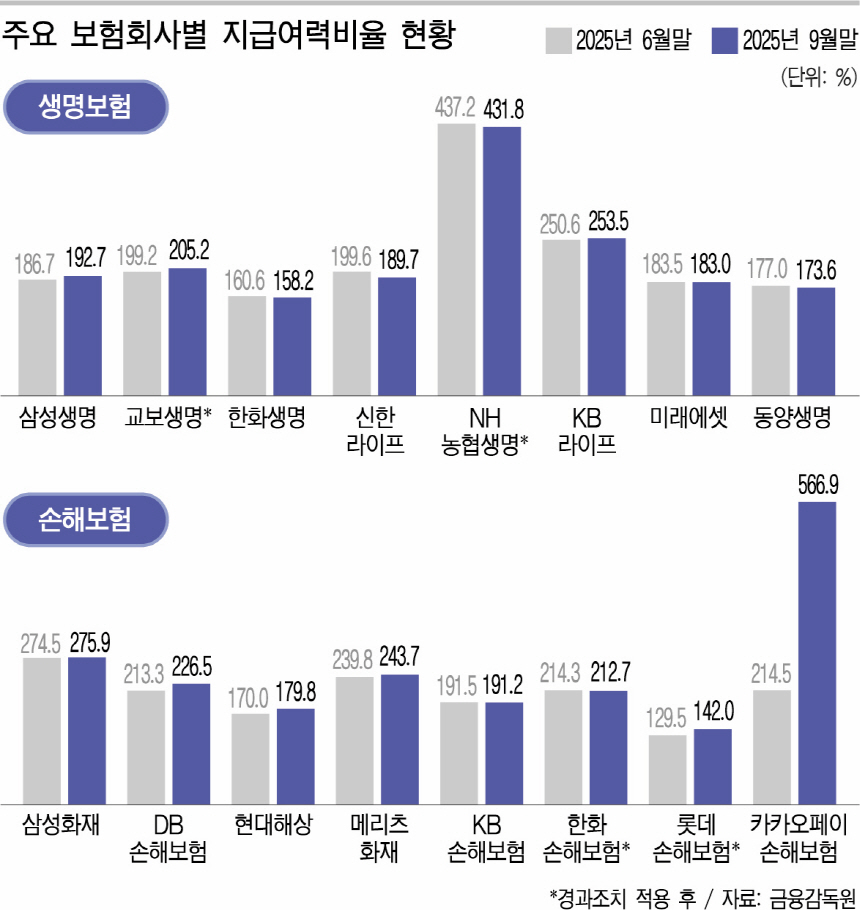
Transitional measures, introduced to mitigate the sudden shock of new financial soundness regulations, currently serve as an essential safety net for many insurance companies. If regulations changed abruptly, a surge of companies would face emergencies in capital expansion; therefore, authorities provided a buffer mechanism allowing a certain period for adjustment. Currently, many life insurance and non-life/reinsurance companies are utilizing this optional application system, striving to adapt to the new regulatory environment. Comparing figures before and after the application of transitional measures reveals more clearly the actual financial condition of the companies. Some major companies have demonstrated robust financial health by maintaining similar figures regardless of whether the measures are applied. On the other hand, companies that might fall below the baseline without the system’s assistance are still building high levees of tension.
Within the mechanisms that mitigate regulatory shock, the true financial strength of each company is revealed.
Transitional measures act as a buffer, reducing the impact of new regulations and helping insurance companies adapt.
4. Diverging Performance Reports of Major Insurance Companies

Examining the actual performance of individual companies shows starkly contrasting fluctuations following market trends, drawing the attention of industry insiders. Samsung Life showed a slight decline compared to the previous quarter, regardless of the application of transitional measures, while Kyobo Life recorded a double-digit decline, showing some stagnation. In contrast, Hanwha Life successfully reversed its trend, demonstrating resilience in boosting its metrics. In the non-life insurance sector, Samsung Fire & Marine showed a clear upward trend, demonstrating excellent soundness, while Nonghyup Insurance also jumped significantly, surprising onlookers. Conversely, DB Insurance saw a considerable drop in its ratio, fully reflecting the volatility in its asset management process. This divergence in fortunes among companies serves as a living textbook showing how crucial risk management is in a rapidly changing financial market.
The magnitude of metric fluctuations varied starkly depending on each company’s investment tendencies.
The extent of changes in solvency ratios varied greatly by company, depending on stock price impacts and asset management results.
5. What is the Solvency Ratio and Why is it Important?

From the perspective of general readers, it is natural to wonder what exactly this ratio is and why it frequently makes the news. The solvency ratio is, simply put, a metric indicating how much emergency reserve a company holds to ensure it can pay the promised insurance benefits to policyholders on time, without any delay, when an incident occurs. The numerator, available capital, represents the company’s actual net assets, while the denominator, required capital, is the statutory reserve that must be accumulated to defend against all potential future risks. The higher this number, the more robust the company’s financial reserves are; conversely, if it falls below the standard, the company faces strict sanctions or management improvement recommendations from financial authorities. This figure is the most reliable barometer for confirming whether the insurance premiums we pay monthly are being managed safely. Therefore, choosing a stable company is a basic principle of wealth management and a wise starting point for preparing for future risks.
It is the most definitive financial soundness indicator for gauging whether insurance benefits can be paid on time.
The solvency ratio, calculated by dividing available capital by required capital, indicates a company’s ability to pay insurance benefits.
6. Future Supervisory Directions and the Stance Consumers Should Take

The Financial Supervisory Service is tightening its grip to ensure insurance companies maintain sufficient breakwaters in response to the rapidly changing market interest rates and the rollercoaster-like stock market. In particular, it plans to significantly strengthen monitoring, focusing on some companies that appear flashy on the surface but lack substance or have fragile capital structures. This serves as a warning that companies that fail to improve capital quality and achieve substantive risk management can be eliminated from the market at any time. We, as general consumers, should also cultivate the habit of occasionally checking a company’s financial soundness metrics rather than simply relying on brand names when signing up. We must entrust our valuable assets to stable and trustworthy companies to ensure we receive full coverage when we truly need it in the future. I sincerely hope you will continue to keep a close eye on the subtle changes in the insurance market and maintain a wise financial life.
As regulatory oversight intensifies, consumers also need to exercise discernment.
Authorities plan to strengthen monitoring of vulnerable insurance companies, and consumers should carefully examine financial soundness.
Frequently Asked Questions
=